安科瑞张浩彬
技术支持:任心怡
摘要:介绍某国际商业广场项目,采用智能电力仪表、采集配电现场的各种电参量、开关信号。系统采用现场就地组网的方式,组网后通过现场总线通讯并远传至后台,通过Acrel-3000型电能管理系统实现楼层及配电房回路用电的实时监控和管理。
Abstract: Introduce an international commercial plaza project, which adopts smart power meters to collect various electrical parameters and switch signals at the distribution site. The system adopts the method of on-site networking. After networking, it communicates via fieldbus and transmits it to the background. The Acrel-3000 power management system realizes real-time monitoring and management of the power consumption of floors and power distribution rooms.
关键词:智能电力仪表;Acrel-3000;电能管理系统;
Keywords: intelligent power meter; Acrel-3000; Energy management system;
0 概述 Overview
该项目位于某经济开发区核心,区域内发展成熟,配套完善、交通便捷。本项目为现场各楼层配电间的用能改造。现场757个配电出线回路安装757台多功能电表采集现场数据。
The project is located in the core of an economic development zone, with mature development, complete supporting facilities and convenient transportation. This project is the energy utilization transformation of the distribution rooms on each floor of the site. On-site 757 power distribution outgoing circuits were installed with 757 multi-function meters to collect field data.
1 需求分析 Demand Analysis
为保证生产管理用电负荷的统计与分析及对危险源实时监控。需要对项目现场的各配电箱等电气设备进行电压、电流、功率等参数进行实时在线监控。一旦监控点被监视参数异常,能够及时检测报警,有关人员采取必要的措施,避免安全事故的发生。自动抄表功能节省了人力物力,功率趋势曲线功能能够直观的显示各回路的工作状态与时间,方便用户找出非正常用电回路并且及时进行整改,建立电能多级计量体系提供用能分析依据。
本技术条件适用于该项目的回路进出线回路。供方产品应具有高安全性与可靠性、易于扩展、便于维修与维护。供方提供的产品应至少满足本技术条件,但不仅于此,其技术性能应满足对设备配电箱数据监控的要求。
To ensure the statistics and analysis of electricity load for production management and real-time monitoring of hazard sources. Real-time online monitoring of voltage, current, power and other parameters of electrical equipment such as distribution boxes on the project site is required. Once the monitoring point is monitored with abnormal parameters, it can detect and alarm in time, and relevant personnel can take necessary measures to avoid safety accidents. The automatic meter reading function saves manpower and material resources. The power trend curve function can intuitively display the working status and time of each circuit, which is convenient for users to find abnormal power circuits and make corrections in time, and establish a multi-level electrical energy measurement system to provide energy analysis basis .
This technical condition applies to the incoming and outgoing circuits of the project. The supplier's products should have high safety and reliability, easy to expand, easy to repair and maintain. The products provided by the supplier shall meet the technical requirements at least, but not only this, but the technical performance shall meet the requirements for data monitoring of the equipment distribution box.
1.1 数据采集 Data Collection
自动采集现场所有电量仪表的模拟量数据,自动采集现场开关状态以及故障状态等开关量数据。
支持实时采集、自动周期采集(定时采集)可配置周期(1分钟~24小时)。
支持数据传输正确性检验,异常数据自动处理。
支持多线程处理机制,提高数据采集效率,能同时对多个设备进行数据采集。
数据实时显示采用配电箱主接线图直观显示模式,各回路开关断合以及故障状态直观可见。
Automatically collect analog data of all power meters on site, and automatically collect on-site switching data such as on-site switch status and fault status.
Support real-time collection, automatic periodic collection (timing collection) configurable cycle (1 minute to 24 hours).
Support data transmission correctness inspection, automatic processing of abnormal data.
Support multi-threaded processing mechanism, improve the efficiency of data collection, and can collect data from multiple devices at the same time.
The real-time data display adopts the intuitive display mode of the main wiring diagram of the distribution box, and the disconnection and fault status of each circuit switch are intuitively visible.
1.2 数据分析与处理 Data Analysis And Processing
数据的综合统计、分析需要实现以下功能:
各设备用电数据小时、日、月、年等时间段内的统计、计算。
各设备的用电负荷(有功、无功)大、小、平均值计算。
统计各分站及整体的用电量(有功、无功)。
Comprehensive statistics and analysis of data need to achieve the following functions:
Statistics and calculation of the electricity consumption data of each equipment within hours, days, months, years and other time periods.
Calculate the large, small and average value of the electrical load (active power, reactive power) of each device.
Count the power consumption (active power and reactive power) of each substation and the whole.
1.3 数据查询与展示 Data Query And Display
要求能方便实现客户端查询和各级管理人员的查询,查询界面能适应各级管理人员的要求能够支持灵活的条件组合查询和对比分析,各类统计分析的数据可灵活采用报表等多种图表方式直观的展示功能。
数据展示功能按照不同用户的不同的权限,分为操作层、管理层、决策层三层用能展示。
操作层具备用能分析、累计用量、实时监测、运行记录及比例、对比、对标分析等功能。
管理层具备用能数据统计和分析、分类分项的对比、对标分析等功能。
决策层具备用能数据分析、数据删除、数据库导入/导出等功能。
It is required to facilitate the realization of client query and query of managers at all levels. The query interface can adapt to the requirements of managers at all levels. It can support flexible condition combination query and comparative analysis. Various types of statistical analysis data can be flexibly used in reports and other charts. Intuitive display function.
According to the different permissions of different users, the data display function is divided into three layers: operation layer, management layer, and decision-making layer.
The operation layer has functions such as energy consumption analysis, cumulative consumption, real-time monitoring, running records and ratios, comparison, and benchmarking analysis.
The management has functions such as statistics and analysis of energy consumption data, comparison of classification and sub-items, and benchmarking analysis.
The decision-making layer has functions such as energy data analysis, data deletion, and database import/export.
1.4 权限管理 Authority Management
要求对不同用户赋予不同角色的权限,能授权到功能子菜单、具体档案记录、数据记录等。
系统要求具备合理完善的用户安全控制机制,能使应用环境中的信息资源得到保护,防止信息的丢失、失窃和破坏。
It is required to assign different roles to different users, and be able to authorize function sub-menus, specific file records, data records, etc.
The system requires a reasonable and complete user security control mechanism to protect the information resources in the application environment and prevent the loss, theft and destruction of information.
1.5 节能改造及效果评估 Energy-Saving Renovation And Effect Evaluation
要求为生产节能改造提供数据支撑,并能提供节能改造前后的效果评估。
It is required to provide data support for the energy-saving transformation of production, and provide the effect evaluation before and after the energy-saving transformation.
1.6 参数设置 Parameter Settings
可通过采集柜设置各回路互感器变比,各种电流电压保护整定值。
故障判断与报警具有故障自动判断并采用声光方式报警功能。报警类型包括开关故障,电压、电流超限,现场采集模块通讯故障,与监控系统通讯故障等。报警时间自动记入系统数据库,方便用户查询,工作人员可随时掌握变配电站实时运行状态,发现变配电运行故障并作出相应处理,提高变配电的管理效率,提升电力系统安全性、可靠性。
The transformer ratio of each loop and the setting value of various current and voltage protection can be set through the acquisition cabinet.
Fault judgment and alarm have automatic fault judgment and use sound and light alarm function. Alarm types include switch failures, voltage and current overruns, communication failures of the field acquisition module, and communication failures with the monitoring system. The alarm time is automatically recorded in the system database, which is convenient for users to inquire. The staff can grasp the real-time operation status of the substation at any time, find the operation failure of the substation and distribution, and make corresponding treatments, improve the management efficiency of the substation and distribution, and enhance the safety of the power system. reliability.
2 系统方案 System Solutions
Acrel-3000系统根据该项目的现场实际情况,整体网络结构采用屏蔽双绞线直接接至监控室的对应的数据采集器然后通过网线直接接至监控主机,保障了电能管理监控系统传输的稳定性与实时性。如下图所示:站控管理层、网络通讯层和现场设备层。
According to the actual situation of the project site, the Acrel-3000 system uses shielded twisted-pair cable to connect directly to the corresponding data collector in the monitoring room and then directly connects to the monitoring host through the network cable, ensuring the transmission of the power management monitoring system. The stability and real-time performance. As shown in the figure below: station control management layer, network communication layer and field device layer.
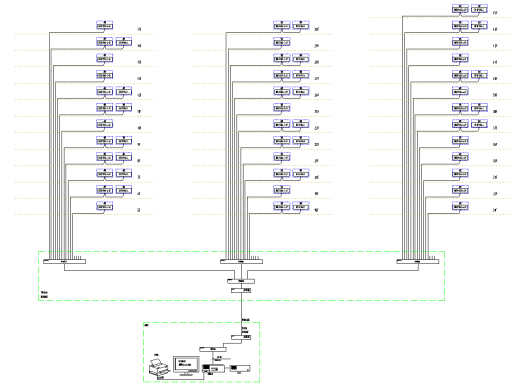
现场共计140只多功能仪表分为12条RS485总线接至配电房的监控工控机,实现总线上仪表与监控主机的数据连通。
A total of 140 multi-function instruments on site are divided into 12 RS485 buses connected to the monitoring industrial computer in the power distribution room to realize the data connection between the instruments on the bus and the monitoring host.
1)站控管理层 Station Control Management
站控管理层针对电力监控系统的管理人员,是人机交互的直接窗口。在该项目中主要指置于配电房的监控主机。
The station control management layer is the direct window of human-computer interaction for the management personnel of the power monitoring system. In this project, it mainly refers to the monitoring host placed in the power distribution room.
2)网络通讯层 Network Communication Layer
通讯层主要是由监控工控机的通讯串口、以太网设备及总线网络组成。串口主要功能是监测现场智能仪表;以太网设备及总线网络的主要功能是实现分站与主站之间的数据交互,使配电系统管理集中化、信息化、智能化,很大提高了配电系统的安全性、可靠性和稳定性,达到了无人值守的目的。
The communication layer is mainly composed of the communication serial port of the monitoring industrial computer, Ethernet equipment and bus network. The main function of the serial port is to monitor on-site intelligent instruments; the main function of the Ethernet equipment and the bus network is to realize the data interaction between the substation and the main station, so that the management of the distribution system is centralized, informatized, and intelligent, which greatly improves the distribution The safety, reliability and stability of the electrical system have achieved the goal of unattended operation.
3)现场设备层 Field Device Layer
现场设备层是数据采集终端,主要由智能仪表组成,智能仪表通过屏蔽双绞线RS485接口,采用MODBUS通讯协议总线型连接接入通讯服务器,经通讯服务器到达该配电间监控主机进行组网,实现远程控制。
The field device layer is the data acquisition terminal, which is mainly composed of smart meters. The smart meters are connected to the communication server through the shielded twisted pair RS485 interface and the MODBUS communication protocol bus connection. The communication server reaches the monitoring host of the power distribution room for networking. Realize remote control.
4) 智能仪表现场连接示意Smart Instrument Connection Diagram
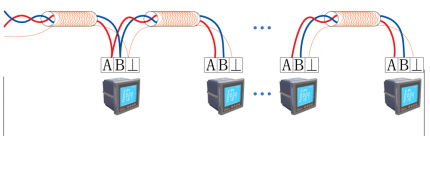
现场仪表以手拉手方式通过屏蔽双绞线(RVSP2*1.0)进行通讯连接,每根总线连接智能仪表数量在20只左右,不同种类的智能装置连接在不同的总线上,然后将数据上传至串口服务器,进而将数据上传至当地监控终端。具体连接示意图如下所示:
Field instruments are connected hand in hand through shielded twisted pair (RVSP2*1.0). The number of smart instruments connected to each bus is about 20. Different types of smart devices are connected to different buses, and then the data is uploaded to the serial port. The server then uploads the data to the local monitoring terminal. The specific connection diagram is as follows:
3 系统功能 System Functions
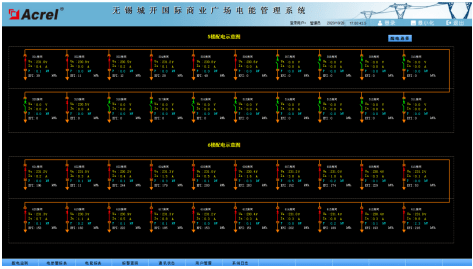
现场实时监控系统图为主监控画面,主要实时监测变电所所有回路的运行状态,红色代表合闸,绿色代表分闸。在系统图中可以直观的看到每路进线和出线的运行参数和状态,可以看到变压器出线侧的所有常规电力参数,如:三相电压、电流、有功功率、无功功率、功率因数、频率、有功电度等。如下图所示:
The on-site real-time monitoring system diagram is the main monitoring screen, which mainly monitors the operating status of all circuits in the substation in real time. Red represents closing and green represents opening. In the system diagram, you can intuitively see the operating parameters and status of each incoming and outgoing line, and you can see all the conventional power parameters on the outgoing side of the transformer, such as: three-phase voltage, current, active power, reactive power, and power factor , Frequency, active power, etc. As shown below:
系统一次图 System diagram
遥信和遥测报警功能,主要完成对低压各出线回路的开关运行状态和负载进线监控,对开关变位和负载越限弹出报警界面指示具体的报警位置并声音报警,提醒值班人员及时处理。负载越限值在相应权限下可自由设置。具备历史查询功能。
The remote signaling and remote measurement alarm function mainly completes the monitoring of the switch operation status of the low-voltage outlet circuits and the load incoming line. The pop-up alarm interface for switch displacement and load limit violations indicates the specific alarm location and sounds the alarm to remind the duty personnel to deal with it in time. The load limit can be set freely under the corresponding authority. With historical query function.
事件告警记录功能,主要完成对查询时间段内出现的报警信息事件记录以及发生时间,为值班人员提供依据并且分析事故发生的原因。
The event alarm recording function mainly completes the recording of the alarm information and the occurrence time of the alarm information that occurred during the query time period, and provides the basis for the staff on duty and analyzes the cause of the accident.
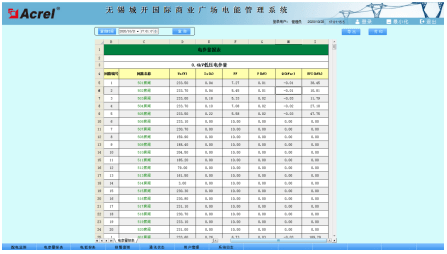
参数抄表功能,主要对低压各出线回路的电参数进线查询。支持任意时刻电参数查询,具备数据导出和报表打印等功能。该报表查询一科大厦楼层配电箱进出线各低压回路的电参数,主要包括:三相电流、有功功率和有功电度。该报表各回路名称和数据库关联,方便用户修改回路名称。如下图所示
Parameter meter reading function, mainly to query the electrical parameters of the low-voltage outgoing circuit. Supports electrical parameter query at any time, with functions such as data export and report printing. This report queries the electrical parameters of the low-voltage circuits of the incoming and outgoing lines of the distribution box on the floor of the Yike Building, mainly including: three-phase current, active power and active energy. The name of each circuit in this report is associated with the database, which is convenient for users to modify the name of the circuit. As shown below
电参数抄表Electric parameter reading
用电量报表功能,可选择时间段进行查询,支持任意时间段电度累计查询,具备数据导出和报表打印等功能。为值班人员提供了准确可靠的电能报表。该报表各回路名称和数据库关联,方便用户修改回路名称。如下图所示,显示办公楼实验楼配电回路的准确用电量,用户可以直接打印报表,可以以EXCEL格式另存到其他位置。 如下图所示:
The power consumption report function can select the time period for query, supports the cumulative query of the power consumption at any time period, and has the functions of data export and report printing. Provide accurate and reliable electric energy report for the staff on duty. The name of each circuit in this report is associated with the database, which is convenient for users to modify the name of the circuit. As shown in the figure below, it shows the accurate power consumption of the power distribution circuit in the laboratory building of the office building. Users can directly print the report and save it to other locations in EXCEL format. As shown below:
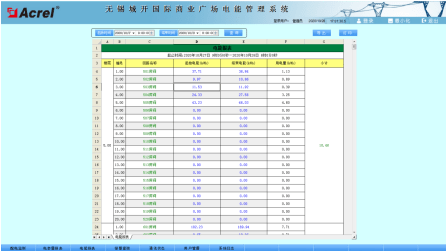
电能报表Energy report
系统通讯结构示意图,主要显示系统的组网结构,系统采用分层分布式结构,同时监测间隔层设备的通信状态。红色表示通讯正常,绿色表示通讯故障。下图为变电所通讯状态示意图。
A schematic diagram of the system communication structure, which mainly shows the network structure of the system. The system adopts a hierarchical distributed structure and monitors the communication status of the bay layer equipment. Red indicates that the communication is normal, and green indicates that the communication is faulty. The figure below is a schematic diagram of the communication status of the substation.
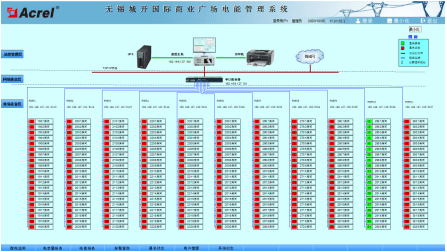
通讯结构示意图 Communication structure diagram
负荷趋势曲线界面中可直观的查看回路的负荷运行情况。查看实时和历史趋势曲线,点击画面相应按钮或菜单项可以完成相应功能的切换;帮助用户进线趋势分析和故障追忆,具备曲线打印功能。为分析整个系统的运行状况提供了直观而方便的软件支持。
In the load trend curve interface, the load operation of the loop can be viewed intuitively. View real-time and historical trend curves, click the corresponding button or menu item on the screen to complete the switch of the corresponding function; help users to enter the line trend analysis and fault recall, with the curve printing function. Provides intuitive and convenient software support for analyzing the operating status of the entire system.
4 结束语 Summary
在当今配电设施的应用中,配电安全性至关重要,本文介绍的Acrel-3000电能管理系统在商业广场项目的应用,可以实现对供配电回路用电的实时监控,不仅能显示回路用电状况,还具有网络通讯功能,可以与串口服务器、计算机等组成电能管理系统。系统实现对采集数据的分析、处理,实时显示配电房内各配电回路的运行状态,对负载越限具有弹出报警对话框、语音提示,并生成各种电能报表、分析曲线、图形等,便于电能的远程抄表以及分析、研究,该系统运行安全、可靠、稳定,为商业广场项目解决用电问题提供了安全可靠的依据,取得了较好的企业效益。
In the application of today’s power distribution facilities, power distribution safety is of the utmost importance. The application of the Acrel-3000 power management system introduced in this article in the commercial plaza project can realize real-time monitoring of the power consumption of the power supply and distribution circuit, not only can display the circuit The power consumption status also has the function of network communication, which can form an electric energy management system with serial server, computer, etc. The system realizes the analysis and processing of the collected data, real-time display of the operating status of each power distribution circuit in the power distribution room, pop-up alarm dialogs, voice prompts for load overruns, and generates various energy reports, analysis curves, graphics, etc., It is convenient for remote meter reading, analysis and research of electric energy. The system is safe, reliable and stable in operation. It provides a safe and reliable basis for the commercial plaza project to solve electricity problems, and has achieved good corporate benefits.
*博客内容为网友个人发布,仅代表博主个人观点,如有侵权请联系工作人员删除。